

Managing short-term rentals across Europe has become increasingly complex as regulations multiply and guest expectations rise. Property managers juggling multiple platforms, compliance deadlines, and operational data often find themselves overwhelmed by manual processes that consume hours each week. Real-time booking dashboards cut compliance work by automating data capture and regulatory submissions, transforming how you manage properties. This guide explains why dashboards have become essential tools for rental success, revealing how automation and centralised insights can dramatically reduce your workload whilst ensuring you meet every regulatory requirement across different jurisdictions.
Table of Contents
- Key takeaways
- How dashboards automate compliance and cut workload
- Centralising data for better multi-property management
- Minimising errors and managing regulation complexity with automation
- Key metrics dashboards track and insights you can trust
- Streamline your rental management with expert dashboard solutions
- Frequently asked questions
Key Takeaways
| Point | Details |
|---|---|
| Regulatory automation | Dashboards automate data capture and submissions to dramatically reduce your compliance workload. |
| Unified data from platforms | Integration consolidates data from multiple PMS and OTAs into a single interface for occupancy, revenue and compliance tracking. |
| Jurisdiction specific formatting | The system formats submissions to meet each jurisdiction’s rules, reducing confusion and errors. |
| Audit trails and alerts | Audit trails document every compliance action and alerts flag upcoming obligations for proactive management. |
| Portfolio time savings | Consolidated data and automated submissions free teams to focus on guest experience and revenue optimisation. |
How dashboards automate compliance and cut workload
The regulatory landscape for short-term rentals has transformed dramatically. Real-time booking dashboards automate compliance with EU Regulation 2024/1028 by capturing live data and reduce workload by up to 50%. This automation represents a fundamental shift from manual data entry to intelligent systems that handle the heavy lifting.
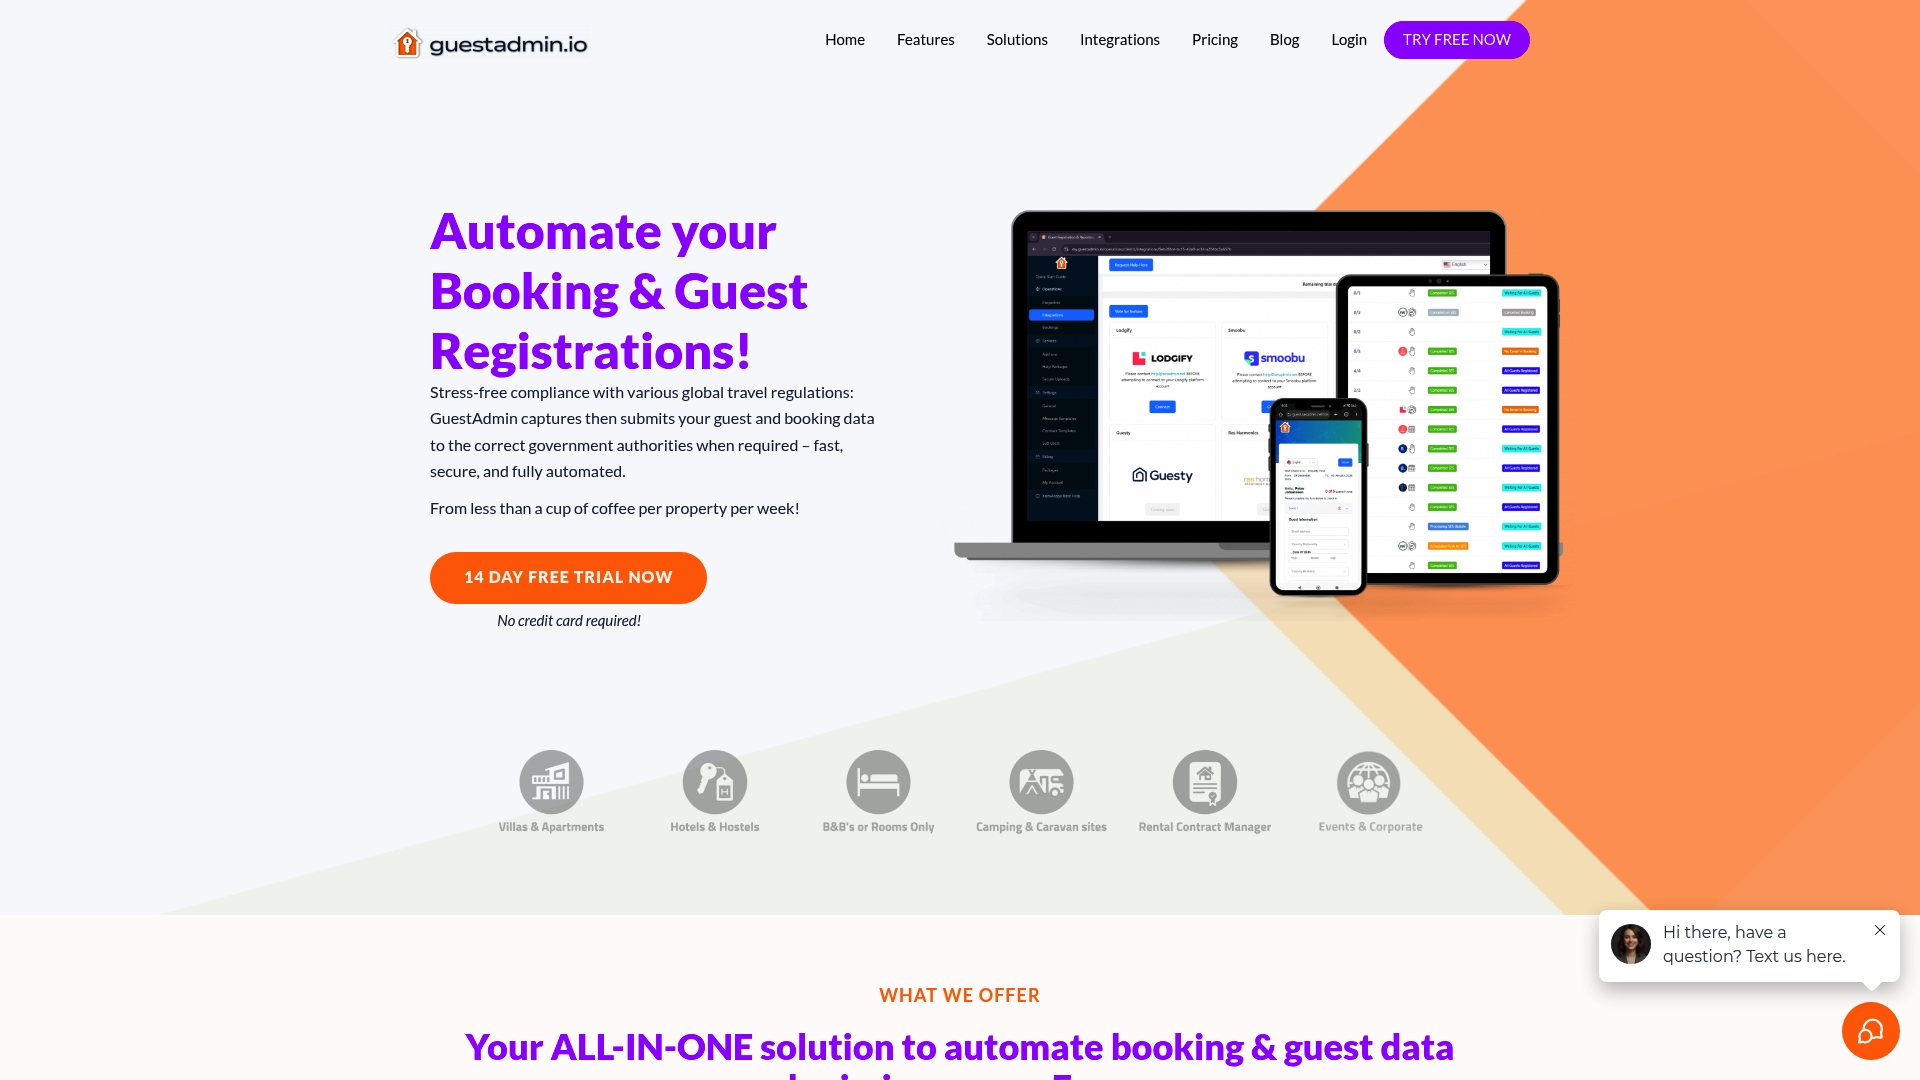
Modern dashboards connect directly to your booking platforms through API integrations and webhooks. These technical connections enable automatic synchronisation of guest information, booking dates, and property details the moment a reservation is confirmed. You no longer need to manually extract data from multiple sources or worry about missing a submission deadline.
The automation extends beyond simple data capture. Dashboards format information according to each jurisdiction’s specific requirements, whether you’re submitting to Italy’s Alloggiati Web system or Spain’s Parte de Viajeros registry. This intelligent formatting eliminates the confusion of navigating different government portals and ensures your submissions match exact specifications.
Key automation features include:
- Live synchronisation with booking platforms eliminates manual data entry
- Automatic formatting for jurisdiction-specific submission requirements
- Scheduled submissions that meet monthly reporting deadlines
- Audit trails documenting every compliance action taken
- Alert systems notifying you of upcoming obligations
The compliance burden reduction is substantial. Property managers previously spending 10 hours monthly on regulatory submissions now complete the same work in under 5 hours. This time saving multiplies across portfolios, freeing you to focus on guest experience and revenue optimisation rather than administrative tasks.
Pro Tip: Set up automated alerts for 48 hours before submission deadlines. This buffer gives you time to review any flagged issues whilst maintaining compliance even if unexpected problems arise.
“Automation has fundamentally changed how we approach compliance. What used to consume entire days now happens in the background whilst we focus on growing our business.” — European property management company
The technology handles multi-jurisdictional complexity with ease. If you manage properties in France, Portugal, and Austria simultaneously, your dashboard tracks different registration requirements, submission formats, and reporting frequencies for each location. This centralised management prevents the confusion and errors that plague manual systems.
Centralising data for better multi-property management
Operating multiple properties across different booking platforms creates data fragmentation that hampers decision-making. Dashboards solve this challenge by consolidating data from multiple PMS and OTAs, providing unified views of occupancy, revenue, and compliance status that transform how you manage your portfolio.

The centralisation begins with integration. Your dashboard connects to Airbnb, Booking.com, Vrbo, and your property management system simultaneously. Every booking, cancellation, or modification flows into a single interface where you can monitor all activity without logging into separate platforms. This unified view eliminates the time-consuming process of checking multiple dashboards and spreadsheets.
Live updates ensure you’re always working with current information. When a guest books a property, the dashboard reflects this immediately alongside updated occupancy rates and revenue projections. This real-time visibility enables quick responses to market changes and operational issues before they impact your business.
Centralised data provides:
- Single source of truth for all booking and guest information
- Instant visibility into portfolio-wide occupancy and revenue trends
- Comparative performance metrics across different properties
- Consolidated compliance status for all jurisdictions
- Historical data analysis for strategic planning
| Manual data management | Dashboard centralisation |
|---|---|
| Check 5-8 separate platforms daily | Review single unified dashboard |
| Manual spreadsheet updates | Automatic data synchronisation |
| Delayed insights from outdated information | Real-time metrics and alerts |
| Hours spent reconciling discrepancies | Automated data validation |
| Limited historical analysis capability | Comprehensive trend analysis tools |
The scalability advantage becomes clear as your portfolio grows. Managing three properties versus thirty requires the same dashboard effort because automation handles the increased complexity. You can unlock efficiency through dashboards regardless of portfolio size, making growth more manageable and less administratively burdensome.
Decision-making improves dramatically with centralised visibility. You can instantly identify which properties are underperforming, spot booking trends across your portfolio, and allocate resources where they’ll have the greatest impact. This strategic advantage helps you stay competitive in crowded markets.
Pro Tip: Configure your dashboard to display the five metrics most critical to your business goals on the main screen. This focused view prevents information overload whilst keeping essential data immediately accessible.
The operational efficiency gains extend beyond monitoring. Centralised data enables bulk actions like adjusting pricing across multiple properties simultaneously or updating availability calendars in response to maintenance schedules. These capabilities transform portfolio management from a series of individual property tasks into streamlined operations.
Minimising errors and managing regulation complexity with automation
Submission errors to government registries create serious problems ranging from fines to operational restrictions. Automation reduces submission errors by over 50%, with alerts for deadlines and GDPR-compliant handling for registrations like Italy’s Alloggiati Web and Spain’s Parte de Viajeros, addressing one of the most significant risks in rental management.
The error reduction stems from eliminating manual data entry. When you type guest information into government portals, mistakes inevitably occur through typos, formatting errors, or misread handwriting. Automated systems extract data directly from booking confirmations, ensuring accuracy from source to submission.
Validation checks catch potential problems before submission. Dashboards verify that required fields are complete, dates are logical, and information matches expected formats. If a guest’s passport number appears incomplete or a check-in date precedes the booking date, the system flags these issues for your review rather than submitting incorrect data.
Automated error prevention includes:
- Source data extraction eliminating manual transcription mistakes
- Format validation ensuring submissions match registry requirements
- Completeness checks identifying missing required information
- Logic verification catching impossible dates or contradictory details
- Pre-submission review allowing manual correction of flagged issues
| Manual submissions | Automated submissions |
|---|---|
| Error rate: 8-12% | Error rate: 3-5% |
| Missed deadlines: 15% | Missed deadlines: <2% |
| Time per submission: 15-20 minutes | Time per submission: 2-3 minutes |
| Compliance documentation: Manual records | Compliance documentation: Automatic audit trails |
Alert systems provide critical deadline management. Rather than tracking submission dates in calendars or relying on memory, your dashboard notifies you of upcoming obligations with sufficient lead time. These alerts account for different reporting frequencies across jurisdictions, ensuring you never miss a deadline regardless of complexity.
The regulatory complexity across Europe is substantial. France requires specific tourist tax declarations, Italy mandates daily guest registration submissions, Spain enforces detailed traveller documentation, and Portugal has unique identification requirements. Managing these varying rules manually creates confusion and increases error risk.
Dashboards handle this complexity through jurisdiction-specific workflows. When you register a property in a new location, the system automatically applies relevant rules and submission formats. You don’t need to research requirements or design custom processes because the platform embeds regulatory knowledge.
GDPR compliance adds another layer of complexity that dashboards address systematically. Personal guest data must be collected, stored, and transmitted securely whilst respecting privacy rights. Automated systems implement encryption, access controls, and data retention policies that meet regulatory standards without requiring you to become a privacy expert.
Pro Tip: Review your dashboard’s audit trail monthly to verify all submissions completed successfully. This proactive monitoring catches any technical issues before they accumulate into compliance problems.
The peace of mind from reliable automation is invaluable. You can confidently focus on guest experience and revenue growth knowing that compliance obligations are being met consistently and accurately across all properties and jurisdictions.
Key metrics dashboards track and insights you can trust
Data without context leads to poor decisions. Single KPIs can mislead without benchmarking; understanding metric relationships is crucial for decision-making that drives sustainable growth rather than short-term gains at long-term expense.
Occupancy rate stands as the most watched metric, showing the percentage of available nights that are booked. High occupancy suggests strong demand, but this metric alone tells an incomplete story. You need to understand occupancy alongside pricing to determine whether you’re maximising revenue or simply filling rooms too cheaply.
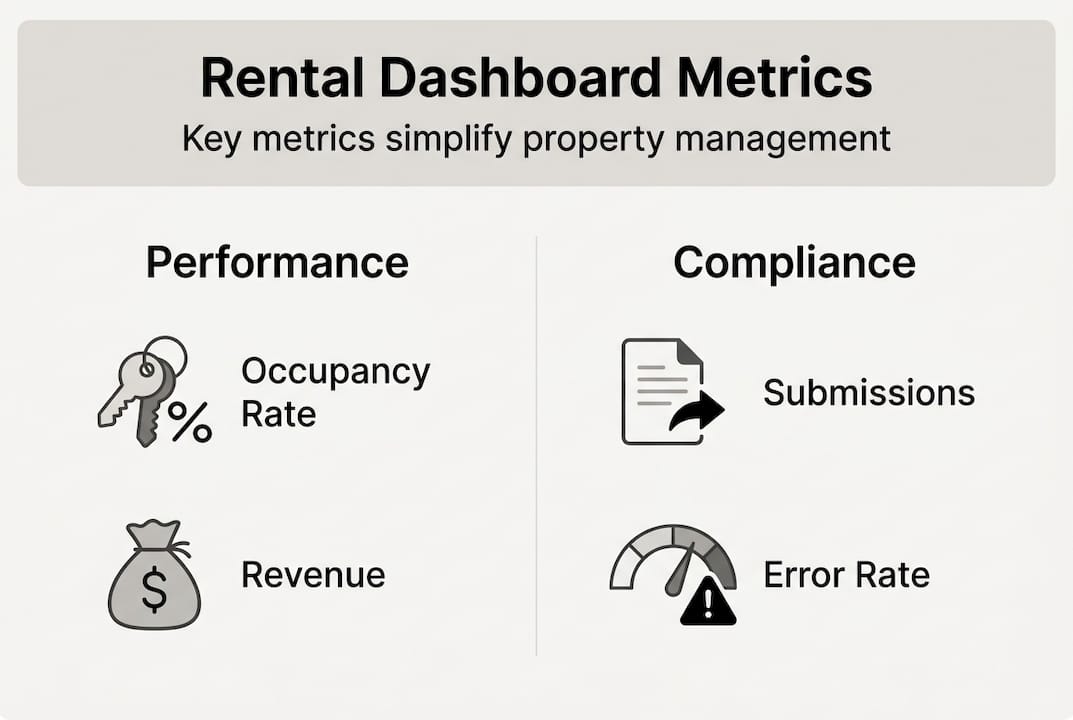
Average daily rate (ADR) reveals your pricing effectiveness. This metric shows the average revenue per occupied night, helping you understand whether your pricing strategy aligns with market conditions. ADR fluctuations signal seasonal patterns, competitive pressures, or the impact of events affecting your location.
The relationship between occupancy and ADR creates your revenue picture. A property with 90% occupancy at £80 per night generates less revenue than one with 75% occupancy at £120 per night. This interaction demonstrates why isolated metrics mislead whilst combined analysis reveals true performance.
Essential dashboard metrics include:
- Occupancy rate showing booking density across time periods
- Average daily rate tracking pricing effectiveness
- Revenue per available night combining occupancy and pricing
- Booking lead time indicating demand patterns
- Cancellation rate highlighting potential issues
- Guest review scores reflecting service quality
Benchmarking transforms metrics from numbers into strategic intelligence. Knowing your occupancy is 75% means little without understanding whether competitors achieve 65% or 85%. Unlock efficiency through dashboards that integrate market data alongside your performance, revealing whether you’re leading, matching, or lagging behind.
The danger of high occupancy with low ADR illustrates metric interaction importance. This combination often indicates underpricing where you’re leaving money on the table. Guests book readily because your rates are below market value, creating full calendars but diminished revenue. Smart dashboards flag this pattern, prompting pricing adjustments.
Conversely, low occupancy with high ADR might signal overpricing or quality issues. If competitors book solid occupancy whilst you struggle, your rates may exceed what the market will bear. Alternatively, negative reviews or poor property presentation might deter bookings regardless of price.
Market analytics integration provides the context needed for confident decisions. Advanced dashboards combine your PMS data with regional market intelligence, showing how your performance compares to similar properties. This benchmarking reveals opportunities you might otherwise miss and validates successful strategies.
Pro Tip: Review metric relationships weekly rather than individual KPIs daily. This broader perspective reveals trends and patterns that daily fluctuations obscure, leading to more strategic decisions.
“We thought our 85% occupancy meant success until benchmarking revealed competitors were achieving 90% at higher rates. That insight drove a pricing strategy overhaul that increased revenue by 23% whilst maintaining strong occupancy.” — Multi-property manager
Seasonal patterns emerge clearly through dashboard visualisation. You can identify booking trends, optimal pricing windows, and periods requiring promotional efforts. This historical insight combined with current performance data enables proactive management rather than reactive responses.
Streamline your rental management with expert dashboard solutions
Transforming compliance chaos into streamlined operations starts with the right tools and guidance. Our platform automates regulatory submissions across European jurisdictions whilst providing the real-time insights you need for confident decision-making. You can explore multi-property management tips essential for managers seeking to optimise operations across growing portfolios.
The complexity of managing short-term rentals in 2026 demands sophisticated solutions that handle compliance automatically. Our dashboard technology connects seamlessly with your existing systems, capturing booking data and submitting it to relevant authorities without manual intervention. You’ll automate booking compliance for short-term rentals in 2026 whilst gaining visibility into every aspect of your operation. Whether you’re managing three properties or thirty, our property management compliance checklist for Europe in 2026 ensures you’re meeting every requirement across all jurisdictions where you operate.
Frequently asked questions
What is a rental management dashboard?
A rental management dashboard centralises data from multiple booking platforms and property management systems into a single interface for real-time monitoring. It integrates sources like Airbnb, Booking.com, and your PMS to display occupancy, revenue, compliance status, and operational metrics in one place. These dashboards automate compliance submissions, reduce errors, and provide actionable insights that improve decision-making. You can unlock efficiency through dashboards designed specifically for short-term rental management challenges.
How do dashboards help with compliance for European rentals?
Dashboards automate data capture and regulatory reporting according to EU Regulation 2024/1028 and jurisdiction-specific requirements. They connect to your booking platforms through APIs, extracting guest information and formatting it for submissions to registries like Italy’s Alloggiati Web or Spain’s Parte de Viajeros. Automated workflows reduce errors by over 50% through validation checks, alert systems for upcoming deadlines, and audit trails documenting every compliance action. This automation ensures you meet obligations across multiple jurisdictions without manual tracking. Learn more about how to automate booking compliance for short-term rentals in 2026.
Can dashboards reduce errors and save time in rental management?
Automation through dashboards cuts submission errors by over 50% compared to manual processes by eliminating transcription mistakes and implementing validation checks. Time spent on compliance tasks is typically halved, with property managers reducing monthly regulatory work from 10 hours to under 5 hours. The error reduction comes from extracting data directly from booking sources rather than manual entry, whilst time savings result from automated submissions and centralised management. You’ll find comprehensive guidance on how to automate guest management for effortless compliance.
What key metrics should rental managers monitor?
Occupancy rate, average daily rate (ADR), and revenue per available night form the core metrics for rental performance. However, these numbers require context through benchmarking against market standards to reveal whether your performance is strong or weak. Understanding metric relationships is critical because high occupancy with low ADR often indicates underpricing, whilst low occupancy with high ADR might signal overpricing or quality issues. Smart dashboards combine your data with market analytics to provide the context needed for strategic decisions. Explore how to unlock efficiency through dashboards that integrate benchmarking and relationship analysis.