

TL;DR:
- Booking analytics in hospitality encompass the entire guest journey, from discovery to post-stay patterns, informing revenue strategies. It uses different funnel stages and analytics types to diagnose issues, predict future trends, and recommend actions, with KPIs aligned to specific business goals. Proper integration and focused metrics enable property managers to make data-driven decisions that improve occupancy, rates, and guest satisfaction effectively.
Booking analytics is one of those terms that gets used broadly in hospitality, yet is frequently misunderstood. Many property managers assume it simply means reviewing how many stays you recorded last month. In reality, what is booking analytics covers the entire journey a potential guest takes before, during, and after a reservation. It tracks who found your property, who viewed it, who converted, and what patterns emerged from all of that activity. When used properly, it becomes one of the most powerful tools you have for improving revenue, occupancy, and guest satisfaction across your portfolio.
Table of Contents
- Key takeaways
- What is booking analytics: the funnel explained
- The four types of booking analytics
- Key booking metrics that actually matter
- Practical uses of booking analytics
- Common pitfalls in booking analytics
- My perspective on where booking analytics actually pays off
- How Guestadmin supports smarter booking management
- FAQ
Key takeaways
| Point | Details |
|---|---|
| Booking analytics spans the full funnel | It tracks guest behaviour from discovery through to completed stay, not just final booking numbers. |
| Four analytics types serve different needs | Descriptive, diagnostic, predictive, and prescriptive analytics each answer a different business question. |
| KPI alignment drives better decisions | Choosing metrics that reflect your actual goals prevents data overload and misguided actions. |
| Integration is non-negotiable | Consistent data definitions across your PMS and OTA channels are needed for reliable analysis. |
| Funnel-stage thinking outperforms single metrics | Analysing each stage separately reveals where performance is actually breaking down. |
What is booking analytics: the funnel explained
Most revenue managers are familiar with occupancy rates and average daily rate. But booking analytics analyses data across the full booking experience, from who found your property to who converted and what happened afterwards.
A useful way to think about this is through four funnel stages:
- Get found. How many travellers are seeing your listing in search results? Visibility metrics sit here, including impression counts, search ranking positions, and market exposure.
- Get viewed. Of those who see your listing, how many click through and examine it? This is where listing quality, photos, and pricing competitiveness start to matter.
- Get booked. What percentage of viewers actually complete a reservation? Conversion rate, average daily rate (ADR), and average length of stay are the headline KPIs tracked here.
- Get smart. What patterns emerge from completed and cancelled bookings? Cancellation rates, lead times, and booking window trends feed into this stage.
This funnel model is practical because it isolates problems. If your occupancy is low, working backwards through the funnel tells you whether the issue is at the visibility stage, the listing quality stage, or the conversion stage. That distinction is critical; the fix for each is completely different.
Pro Tip: Set up separate dashboard views for each funnel stage rather than relying on a single summary report. This makes it far easier to spot which stage is underperforming each week without combing through raw data.
Booking dashboards built around this funnel logic, like those described for European rental managers, make the analysis far more practical and actionable for busy property managers.
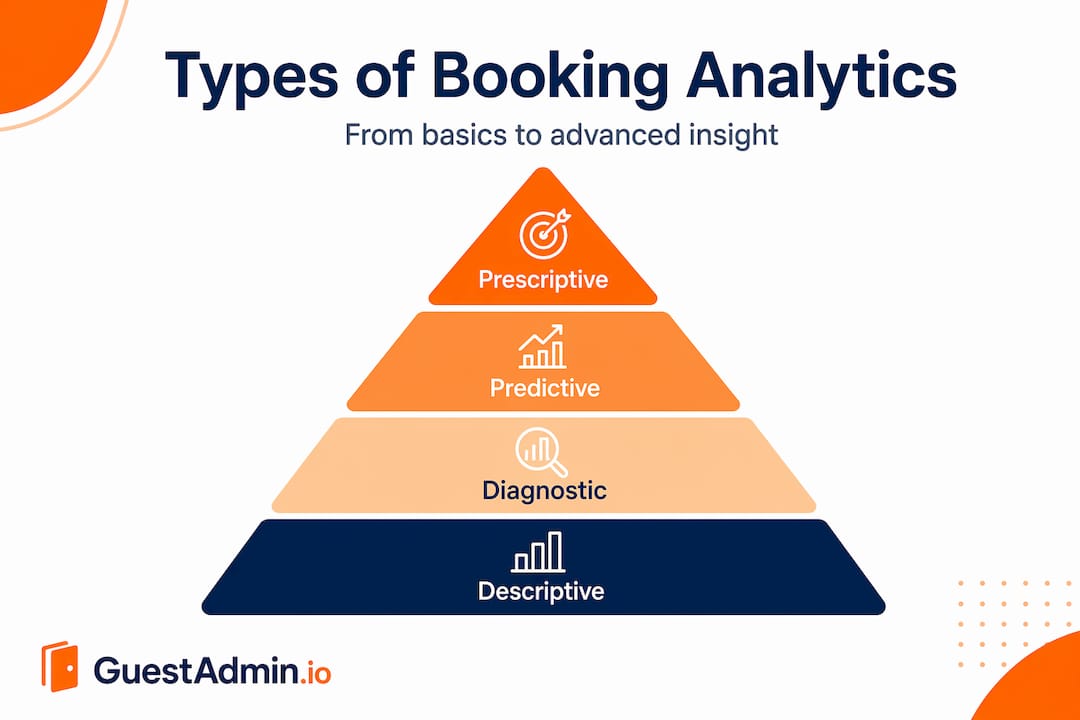
The four types of booking analytics
Understanding what type of analysis you are performing changes how you act on the output. Hotel analytics use four distinct types of data processing, each answering a progressively more strategic question.
-
Descriptive analytics tells you what happened. Total bookings, revenue per available room (RevPAR), and occupancy percentages over a set period all fall into this category. It is the starting point, but it cannot explain performance on its own.
-
Diagnostic analytics tells you why it happened. If your cancellation rate spiked in March, diagnostic analytics compares that against factors like rate changes, booking window shifts, or competitor pricing. It adds context to the numbers.
-
Predictive analytics tells you what is likely to happen next. By analysing historical booking trends, seasonality, and demand signals, predictive tools can forecast occupancy and revenue for future periods. This is particularly valuable when setting pricing strategy weeks ahead of peak dates.
-
Prescriptive analytics tells you what to do about it. This is the most advanced type. It translates forecasted demand into specific pricing, availability, and promotional recommendations. When your booking engine flags that a date is filling slowly compared to prior years, prescriptive analytics surfaces the suggested rate adjustment.
Each type builds on the last. Most hospitality businesses start with descriptive reporting and progress towards predictive and prescriptive capabilities as their data maturity grows.
Pro Tip: If you are just starting with booking analytics, audit which of these four types your current tools actually support. Many property managers assume they have predictive capability when they are actually still working entirely from descriptive reports.
The importance of booking analytics grows significantly once you move beyond descriptive reporting. The real competitive advantage comes from understanding why outcomes happened and what you should do next.

Key booking metrics that actually matter
The difference between a metric and a KPI is worth clarifying. A metric is any measurable data point. A KPI is a metric that is directly connected to a business goal. Tracking every available metric wastes attention. The goal is to identify the KPIs that reflect the outcomes your business is working towards.
Here is a comparison of the most commonly used booking KPIs and what each one actually measures:
| KPI | What it measures | Why it matters |
|---|---|---|
| Occupancy rate | Percentage of available nights booked | Indicates demand but can mask rate strategy issues |
| Average daily rate (ADR) | Average revenue per occupied room per night | Reflects pricing performance independent of occupancy |
| RevPAR | Revenue per available room (ADR x Occupancy) | Combines rate and occupancy into a single revenue view |
| Conversion rate | Percentage of viewers who complete a booking | Diagnoses listing and pricing effectiveness |
| Cancellation rate | Percentage of bookings subsequently cancelled | Flags policy, pricing, or market confidence issues |
| Average length of stay | Mean number of nights per booking | Informs minimum stay settings and operational planning |
HSMAI recommends prioritising KPIs like occupancy, ADR, and RevPAR alongside guest satisfaction and profit metrics, and being deliberately selective to avoid what they call “noisy data.” The risk of tracking too many metrics at once is that no single one gets the attention it needs. Focusing your weekly reporting on four to six KPIs aligned to current business priorities is far more productive than producing comprehensive dashboards that nobody reviews in depth.
Booking trends analysis becomes most useful when KPIs are reviewed over time rather than in isolation. A single week of low conversion means little. A six-week downward trend in conversion compared to the same period last year signals something that needs investigation.
Practical uses of booking analytics
Understanding what are booking metrics and how they are structured is one thing. Knowing how to use booking analytics in day-to-day decision-making is where the real benefit materialises.
Booking analytics tools guide prioritised actions based on where in the funnel performance is lagging. Here is how that translates into specific operational and commercial decisions:
- Low visibility scores suggest your listing is not appearing in enough search results. Actions here include adding more available dates, refreshing the listing with updated photos, or reviewing your position within OTA ranking algorithms.
- High view rates but low conversion points to a listing quality or pricing issue. The traveller found you, looked at your property, and decided not to book. That is a pricing competitiveness problem, an incomplete listing, or weak review scores.
- High conversion but high cancellations is a signal worth investigating carefully. It can indicate misleading listing content, poor cancellation policy design, or pricing that attracted price-sensitive guests who then baulked at additional fees.
- Short booking windows suggest guests are booking closer to their stay date. This can reduce your ability to plan operationally, but it also signals an opportunity to adjust dynamic pricing strategies as dates approach.
- Long length-of-stay trends can inform minimum stay settings and help reduce the operational cost per booking, particularly relevant for multi-property operators managing cleaning and maintenance resources.
Integrating your booking analytics across your property management system (PMS), booking engine, and OTA extranets is what makes this level of analysis possible. Consistent definitions across integrated systems reduce the confusion that arises when gross bookings in one platform do not match net bookings in another. Getting this right requires deliberate setup, not just plugging platforms together.
Real-time visibility into booking data also supports regulatory compliance workflows. When guest data flows automatically from booking through to government reporting systems, you reduce both manual effort and the risk of missed submissions. Secure booking data workflows are as much a part of analytics hygiene as the KPIs themselves.
Common pitfalls in booking analytics
Even experienced property managers fall into predictable traps when working with booking data. Recognising these early saves considerable time and prevents decisions being made on flawed analysis.
- Over-reliance on occupancy. Focusing solely on occupancy leads to missed revenue opportunities. A property running at 95% occupancy at a rate that is 20% below market is underperforming commercially, even though the headline number looks strong.
- Misaligned KPIs. Metric misalignment with hotel goals is the most common cause of analytics failure. If your business goal is to increase profit margins rather than raw occupancy, your KPIs need to reflect profitability rather than volume.
- Inconsistent data definitions. Comparing cancellation rates across two platforms is meaningless if one counts cancellations at the time of guest request and the other counts them at the time of refund processing. Data definitions must be standardised across all systems before any cross-platform analysis is valid.
- Treating booking analytics as post-stay reporting. One of the most persistent misconceptions is that analytics only applies to historical stays. Booking-window and conversion funnel dynamics are the levers that affect revenue before a guest even arrives. Waiting until after a stay to analyse performance means you have already missed every opportunity to influence it.
- Ignoring funnel stage diagnosis. Raw booking numbers do not tell you where performance broke down. Funnel-stage analysis does.
Pro Tip: Before building any new analytics report, write down the specific business decision it will inform. If you cannot name the decision, you probably do not need the report.
My perspective on where booking analytics actually pays off
In my experience, the biggest shift in how property managers use booking analytics comes when they stop treating it as a reporting function and start treating it as a planning function.
I have seen operators invest in sophisticated dashboards and then use them only to confirm what they already suspected. That is a waste. The real value is in surfacing things you did not know to look for. A drop in visibility at a specific booking window, a conversion anomaly on a particular room type, a cancellation spike tied to a single OTA channel. These are the signals that change commercial decisions.
What I have learned about the benefits of analysing bookings is that the funnel-based approach is genuinely more useful than top-level summaries. Most operators I speak with are working from monthly occupancy reports. The ones outperforming their compset are working from weekly funnel reviews tied directly to pricing and availability decisions.
The integration challenge is real, and I would not understate it. Getting your PMS, OTA channels, and booking engine talking to each other with consistent definitions is work. But it is foundational work. Without it, you are comparing apples to oranges across every report you produce.
My honest advice: start simple, align your KPIs to two or three real business goals, and build from there. Analytics complexity should grow in proportion to your ability to act on what it reveals.
— Alex
How Guestadmin supports smarter booking management
If you are looking to put booking analytics into practice across your property portfolio, the tools you use to capture and manage booking data matter enormously. Guestadmin is built for property managers and owners operating in the European short-term rental market, where booking data is not just a commercial resource but also a compliance requirement.
Guestadmin’s real-time dashboards give you visibility into booking activity across multiple properties in one place, making funnel-stage analysis far more practical. The platform integrates with leading PMS and OTA systems, which means your booking data stays consistent and reliable rather than fragmented across separate portals. For those managing guest compliance submissions, Guestadmin automates the capture and submission of guest data to government authorities, removing a significant layer of administrative work.
If you are evaluating your current property management setup, the top property management software comparison on the Guestadmin site is a good starting point. For managers running multiple properties, the multi-property management guide covers how to keep compliance and booking oversight aligned as your portfolio grows.
FAQ
What is booking analytics in hospitality?
Booking analytics is the process of collecting and interpreting data across the full booking journey, from how guests find a property to what happens after a reservation is made. It includes metrics such as conversion rate, ADR, cancellation rate, and booking window trends.
Why does booking analytics matter for revenue management?
The importance of booking analytics lies in its ability to identify where revenue opportunities are being lost, whether at the visibility, conversion, or post-booking stage, so managers can take targeted corrective action.
What are the most important booking metrics to track?
The core booking metrics for hospitality businesses are occupancy rate, ADR, RevPAR, conversion rate, cancellation rate, and average length of stay. Each one should be tied to a specific business goal rather than tracked in isolation.
How does booking trends analysis improve pricing decisions?
Booking trends analysis reveals patterns in booking windows, demand seasonality, and conversion behaviour that inform dynamic pricing strategies. When you can see that bookings for a specific date are pacing below prior-year levels, you can adjust rates proactively rather than reactively.
What is the difference between a metric and a KPI in booking analytics?
A metric is any measurable data point from your booking activity. A KPI is a metric that is directly linked to a business objective. Not every metric deserves equal attention; selecting KPIs aligned to your commercial goals is what makes analytics operationally useful rather than overwhelming.